There is growing recognition that changes in the transportation industry are required for agencies to meet their sustainability targets. Sustainability has evolved to be more than just measuring carbon emissions, and detailed tracking and analysis can help cities plan, evaluate, and communicate their target initiatives.
Master plans and official plans set high-level, long-term targets. Analysts can use CurbIQ to report on progress, or develop implementation plans, easily toggling between high-level metrics and detailed segments. Example metrics are outlined below.
Active Transportation: Identify the required deployment of cycling facilities over the next 5, 10, and 15 years to achieve the final target.
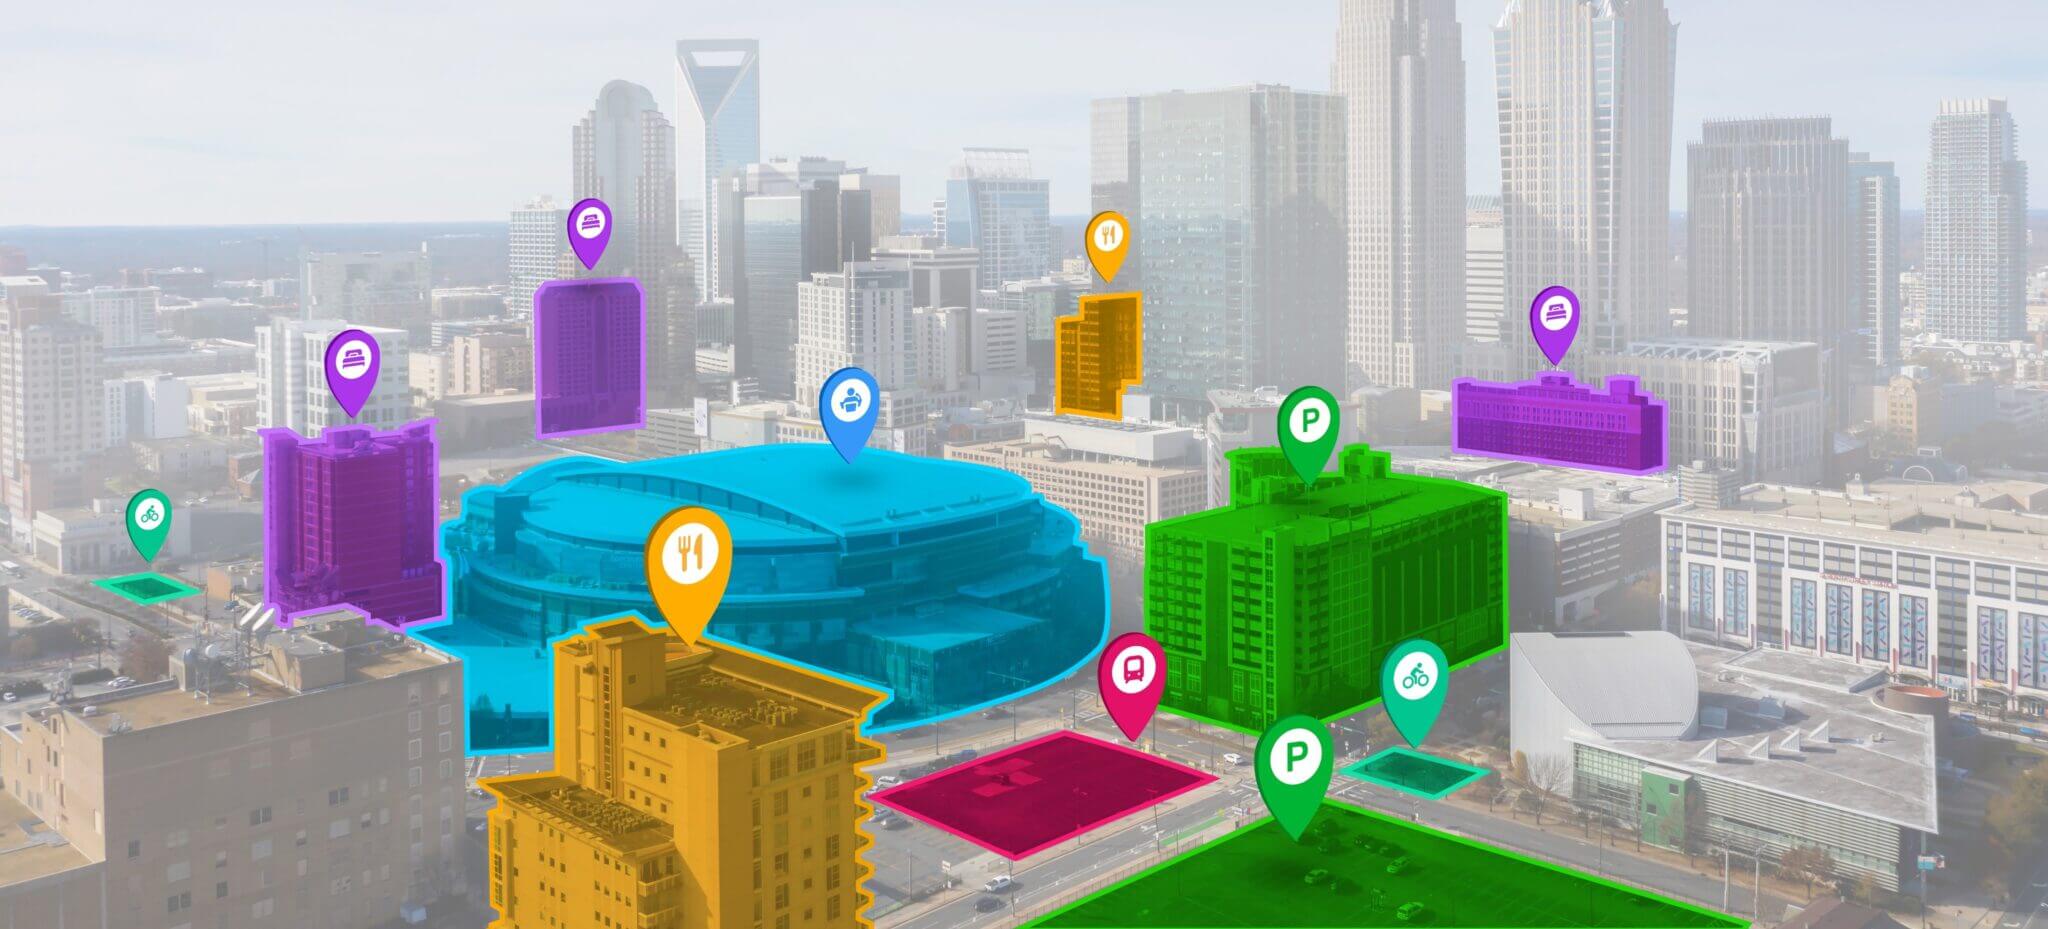
Micromobility: Report the city coverage, number of stations, connectivity to public transportation, etc.
Green and Blue Infrastructure: Report the % of curb dedicated to curb bulb outs, additional planting and trees, rain gardens.
Livability: Report on the % of curb re-allocated to patios, public seating, sidewalk extensions, activation, and others.
Sustainability Index: Create weightings and rankings to aggregate your city’s metrics and calculate the. customized sustainability index for streets, neighbourhoods, or districts. Use the index to simplify the conversation and help make decisions
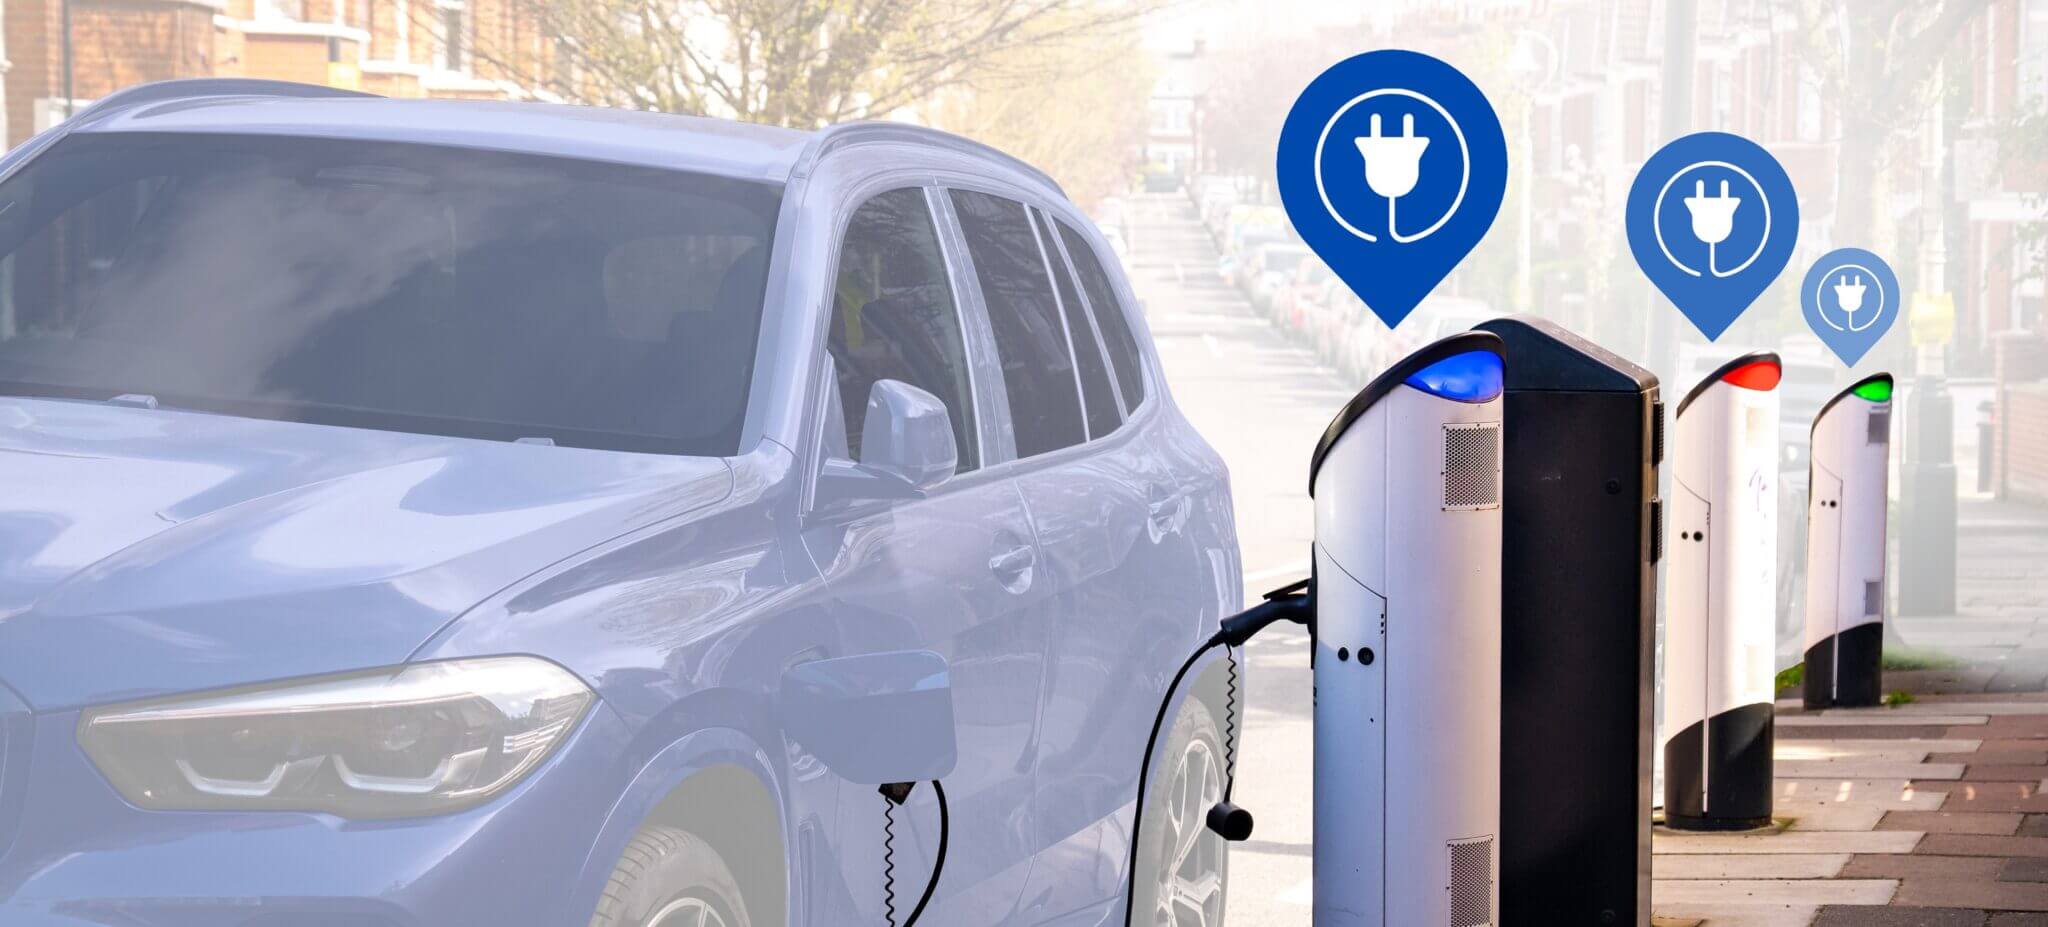
Zero Emission Delivery / Electric Vehicle Charging: Report on the % coverage, network integration, etc.
CurbIQ can help cities achieve their sustainability targets from start to finish, quantifying existing conditions, helping analysts develop implementation plans, and report on progress. The map-based interface also allows for trend analysis and insightful reporting, such as links between micromobility and equity, loading zones and density, or micromobility and modal split.


Above: Curb Analyzer Supply Dashboard for (a) Existing Supply and (b) Proposed Bicycle Lane Supply
Below: Curb Analyzer Comparison Dashboard for both (a) Existing Supply and (b) Proposed Bicycle Lane Supply